The CATRACA architecture is composed of three layers: Visualization Layer, Processing Layer and Capture Layer.
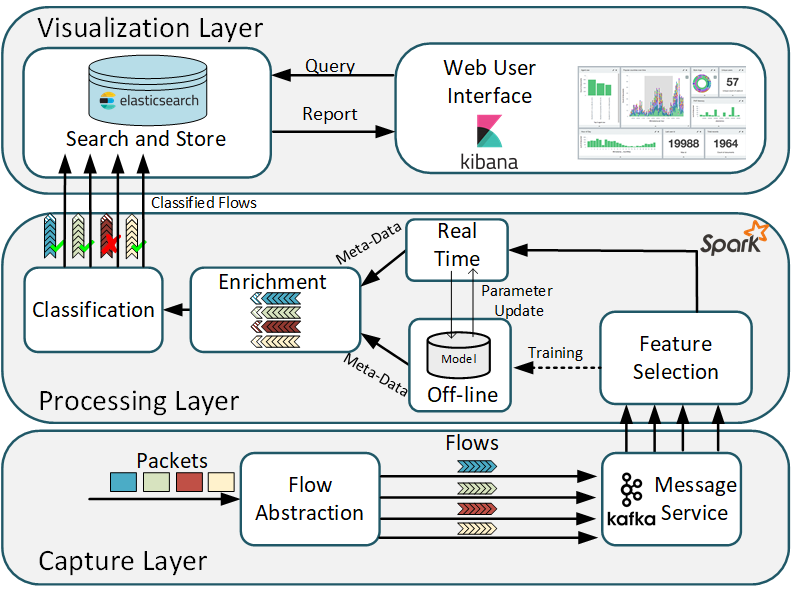
The first layer, the capture layer, is responsible for capturing the packets. The packets are captured, through traffic mirroring, by the libpcap library. A python application based on flowtbag abstracts the packets into flows. A flow is defined as a sequence of packets with the same quintuple source IP, destination IP, source port, destination port, and protocol, during a time window. In all, 46 flow features are extracted and published in a producer/consumer service of Apache Kafka. This service operates as a low latency queue and data flow manipulation system, where queue features are consumed by the processing layer.
The processing layer is instantiated in a dedicated cloud for classification and it core is the Apache Spark. The Spark framework has been chosen among the different flow-processing platforms because it presents the best fault tolerance performance 1, making CATRACA more robust in case of failure. Spark is implemented in a cluster following the master/slave model, where slaves have the capacity to expand and reduce resources, making the system scalable. Once the flow arrives in the processing layer, the feature selection algorithm 2 selects the most important characteristics for threat classification.
In the processing step, the processed metadata is enriched through different information such as the geographical location of the analyzed IPs. Finally, the flows are classified as malicious or benign through machine learning (ML) algorithms based on decision trees.
Finally, the visualization layer is implemented using the Elastic Stack. The elastic stack allows custom event viewing in real time. Thus, the output of the processing layer is sent to the elasticsearch which provides a fast search and store service. Elasticsearch communicates through queries with the user interface that runs in the Kibana environment in which represents the results to be viewed by the user.
 © 2017 Grupo de Teleinformática e Automação GTA/UFRJ
 CATRACA GTA/UFRJ